Elliott Waves
Ralph Nelson Elliott, an accountant rather than a trader by background, spent the 1930s studying decades of stock market data and concluded that price doesn’t move randomly, it moves in a repeating rhythm of five waves one way followed by three waves back, over and over, at every size from a few hours to several decades. That rhythm is what Elliott Wave theory tries to count, and it’s built directly on the impulse and corrective distinction from the previous article.
The five-three structure
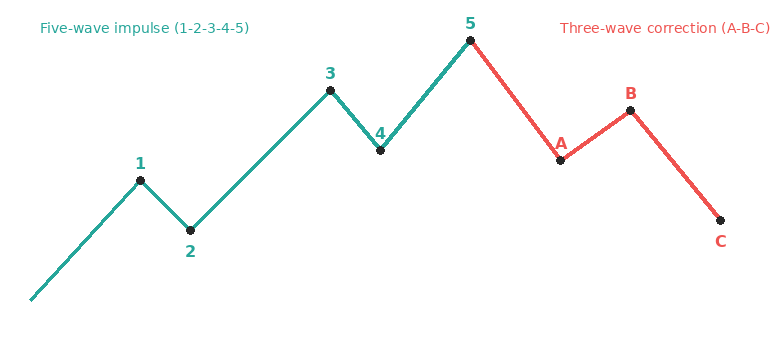
A complete cycle: five impulse waves (1-2-3-4-5) with the trend, followed by a three-wave correction (A-B-C) against it.
The impulse leg breaks into five waves. Waves 1, 3, and 5 move with the trend, waves 2 and 4 correct against it without fully retracing the wave before them. Once the fifth wave completes, a three-wave correction follows, labelled A, B, C, which unwinds part of the whole move before the next impulse can begin.
A handful of rules keep a wave count honest: wave 2 can’t retrace beyond where wave 1 started, wave 3 is never the shortest of waves 1, 3, and 5, and wave 4 shouldn’t move back into wave 1’s price territory. These aren’t stylistic preferences, a count that breaks one of them is a count that needs rethinking.
Fibonacci shows up often
Elliott practitioners lean heavily on Fibonacci ratios to judge whether a wave count looks right, wave 2 commonly retracing somewhere around 50 to 61.8% of wave 1, wave 4 often landing in a shallower retracement of wave 3, and wave 3 frequently extending to 1.618 times the length of wave 1. These are tendencies rather than laws, useful for judging whether a proposed count is proportioned the way real Elliott waves usually are, not a guarantee any given wave will respect a particular number.
The overfitting problem
In real time, on the right-hand edge of the chart, there is very rarely one obvious wave count. Two experienced Elliott traders can look at the same chart and land on different labels, both defensible, and the count that eventually turns out to be “correct” is often only obvious after the fact. It’s easy to fall into forcing a chart to match a preferred narrative instead of letting the chart tell you what it’s doing, relabelling waves after the event to make a broken count look right in hindsight.
The more useful way to hold this theory is as a rough map of where price might sit within a bigger structure, not a standalone entry signal. Used alongside the more concrete tools already covered in this section, structure, zones, fair value gaps, it can add context for how far a move might still have to run. Used on its own as the whole basis for a trade, it’s asking more certainty of the count than the count can honestly give.
Key takeaways
- The core rhythm is five waves with the trend (1-2-3-4-5), then three waves against it (A-B-C)
- Wave 2 can’t retrace past the start of wave 1, wave 3 is never the shortest impulse wave, and wave 4 shouldn’t overlap wave 1
- Fibonacci ratios (around 50-61.8% for wave 2, 1.618x for wave 3 extensions) are common tendencies, not guarantees
- Real-time wave counts are often ambiguous, and relabelling after the fact to fit a preferred story is the main trap
- Best used as context for a bigger structure, not as a signal to trade on by itself
Nothing on this page is financial advice. Trade your own account, manage your own risk.
See also: Tools — indicators that help with this on a live chart.
Nothing on this page is financial advice. Trade your own account, manage your own risk.