What Is Market Structure?
Strip a chart back to just its highs and lows and you’re left with the market’s own record of who’s winning, buyers pushing price into new territory or sellers dragging it into old territory, and reading that record is what market structure means. Everything else in this section, order blocks, fair value gaps, supply and demand, is a zone found within that larger structure, so it’s best to get this part right before layering anything else on top.
Swing highs and swing lows
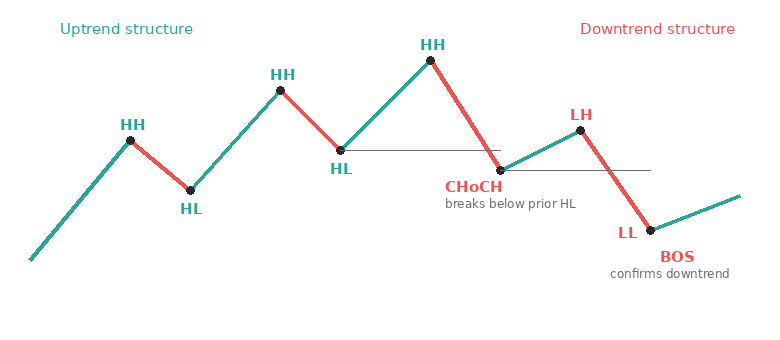
An uptrend of higher highs and higher lows, a change of character (CHoCH) breaking that pattern, then a break of structure (BOS) confirming the new downtrend.
A swing high is a candle with lower highs on both sides of it, a single peak the price couldn’t get back above on the next attempt. A swing low is the mirror image, a candle with higher lows on both sides, a trough the price couldn’t push back below. These two shapes are the entire alphabet market structure is written in, and once you can spot them on sight, the rest of this page is just naming the patterns they form.
Timeframe changes the size of the swings but not the logic. A swing high on the one-minute chart and a swing high on the daily chart are found the same way, they just represent very different amounts of time and price.
Trending structure
When each new swing high sits above the last one, and each new swing low sits above the last one too, that’s an uptrend, usually written as higher highs and higher lows (HH/HL). Buyers aren’t just winning individual rounds, they’re winning them at progressively better prices, and each pullback finds support before the last low gets threatened.
A downtrend is the same idea in reverse, lower highs and lower lows (LH/LL), where sellers keep forcing price into new territory and every bounce fails before it reaches the previous high.
Neither direction needs to move in a straight line to count. An uptrend still has down candles in it, sometimes long strings of them, the structure just needs the higher-high-higher-low pattern to keep holding through those pullbacks.
Ranging structure
A range is what’s left when neither side manages a clean run, price keeps testing a ceiling and a floor without breaking meaningfully past either one, and the swing highs cluster around roughly the same level instead of climbing, while the swing lows do the same at the bottom instead of falling. Trading a range calls for a different mindset to trading a trend, fading the edges rather than following a direction, and mistaking one for the other is a common way to get caught leaning the wrong way right as price finally does break out.
Change of character (CHoCH)
A change of character is the first break in the pattern, the first lower low in what had been a run of higher lows, or the first higher high in what had been a run of lower highs. It’s not proof the trend has reversed, it’s the market’s first hint that the side in control might be losing its grip, so mark the moment it happens instead of waiting for confirmation, because confirmation is what the next signal is for.
In the diagram above, the run of higher highs and higher lows holds until price fails to hold the last HL and breaks below it instead, that’s the CHoCH, the first sign the uptrend’s rhythm has broken.
Break of structure (BOS)
A break of structure is what happens next, price breaking the most recent swing point in the new direction, and it’s what turns a change of character from a warning into a confirmed shift. After a CHoCH to the downside, a break below the next swing low is the BOS that confirms a new downtrend is underway, the same higher-high-higher-low pattern reasserting itself, just now running in the opposite direction.
The distinction matters because a CHoCH on its own is common and often fails, price snaps back into the old trend more often than it commits to a new one, while a BOS is the market following through on that first warning.
Why this is the framework everything else sits on
Order blocks, fair value gaps, and supply and demand zones all describe places where price is likely to react, but none of them say anything about which direction is favoured right now, that’s what structure is for. A bullish order block found inside a confirmed uptrend is a different proposition to the same-looking candle sitting just after a break of structure to the downside, even though the zone itself looks identical on the chart. Structure is the context those zones get read against, not a separate tool competing with them.
Key takeaways
- A swing high has lower highs on both sides, a swing low has higher lows on both sides
- Higher highs and higher lows (HH/HL) is an uptrend, lower highs and lower lows (LH/LL) is a downtrend
- A range is neither, swing highs and lows both cluster instead of progressing in one direction
- A change of character (CHoCH) is the first break against the prevailing pattern, a warning rather than a confirmation
- A break of structure (BOS) is price following through on that warning, confirming the new direction
- Structure is the context every zone in this section gets read against, not a separate signal on its own
Nothing on this page is financial advice. Trade your own account, manage your own risk.
Nothing on this page is financial advice. Trade your own account, manage your own risk.