How to Trade Trendline Breaks
A trendline break is one of the easiest signals to spot on a chart and one of the easiest to get burned by, because a wick punching through the line and a candle closing decisively below it can look almost identical in the first second or two. Knowing which one you’re looking at is most of the skill.
Drawing the line that matters
A trendline connects a series of swing points, higher lows in an uptrend or lower highs in a downtrend, and the more times price has respected it, the more traders are watching the same line. Two touches is barely a trendline, it’s a line drawn through two points, which is true of almost anything. Three or more clean touches is where it starts to earn attention, because that’s evidence the market itself is treating the line as a level rather than you imposing one on the chart after the fact.
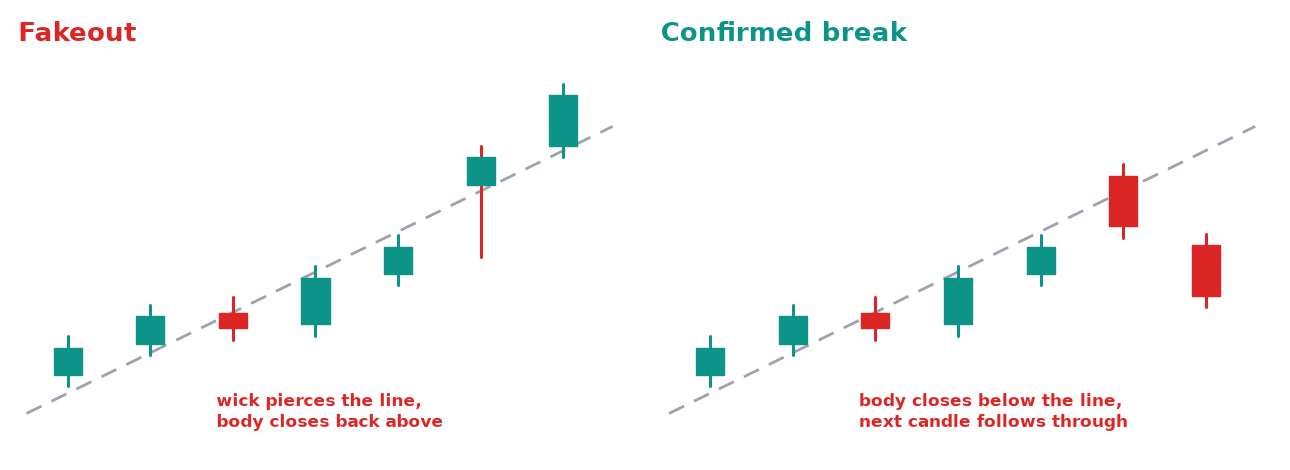
A wick through the line that snaps back above is a fakeout. A candle that closes below and keeps going is a confirmed break.
The wick vs the close
The single most useful habit here is waiting for the candle to close before deciding anything. A wick poking through a trendline tells you price tested the line and got rejected, that’s often a continuation signal in the trend’s original direction, not a reversal. A candle that closes on the other side of the line, especially with the next candle following through instead of snapping straight back, is a different situation, that’s the market telling you the line no longer holds.
Example: EURUSD wicks below an ascending trendline on the four-hour chart, then closes back above it on the same candle, and that wick is often a stronger continuation signal than a reason to short.
Confirmation beyond the close
A single close beyond the line is a reasonable first signal, but it isn’t proof on its own, price snaps back through a broken trendline often enough that a second candle continuing in the new direction confirms the break far more reliably than the first close alone. This costs a little entry price compared to acting on the first close, and that trade-off pays off, since acting on every first close means eating every fakeout that reverses immediately after.
Steepness matters more than most traders think
A trendline drawn too steeply, connecting swings from a sharp, fast move, breaks constantly and means very little each time it does, because that steep angle was never sustainable and the break just reflects the move slowing back to a normal pace. A shallower trendline drawn across a longer stretch of price carries more weight when it finally breaks, since it’s describing the market’s actual trend, not one aggressive burst inside it. If a trendline is breaking every few candles, the angle is probably the problem, not the market.
Key takeaways
- A trendline needs three or more clean touches before it’s meaningful, two points is just a line
- A wick through a trendline that closes back on the original side is often a continuation signal, not a break
- A candle that closes beyond the line, followed by a second candle continuing that direction, is a stronger signal than the first close alone
- A trendline drawn too steeply breaks constantly and means little each time, redraw it across a longer stretch instead
- Waiting one extra candle for confirmation costs some entry price but avoids most fakeout reversals
Nothing on this page is financial advice. Trade your own account, manage your own risk.
Nothing on this page is financial advice. Trade your own account, manage your own risk.