Candlestick Patterns
Look closely at a single candle and you’re looking at a compressed little history of everything buyers and sellers did to each other over that stretch of time. The open tells you where the argument started, the close tells you who was left standing, and the wicks show you the ground that got fought over and lost. Once you can read that shape properly, the name attached to it stops mattering very much, though the names still help, if only so you’re not at sea when someone mentions a “shooting star” on a chart.
Single-candle patterns
Doji
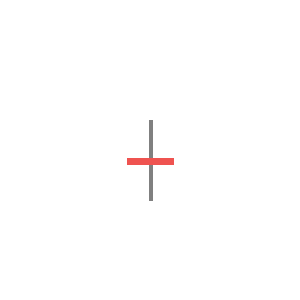
A doji: open and close pinned to almost the same price, wicks either side.
Here, the open and the close land on almost exactly the same price, however far the wicks reach out on either side, and nobody won this round. Taken on its own it just shows indecision, but where it gets interesting is context. I mostly only pay attention to a doji when it turns up after a strong run, or sitting right at a level I was already watching. Buried in the middle of a quiet range, it’s just noise.
Example: EURUSD grinds higher through the New York session, prints a doji right at the day’s high, then rolls over the next morning, and that’s the kind to mark. A doji in the middle of an Asian-session chop isn’t telling you anything.
Pin bar (hammer / shooting star)
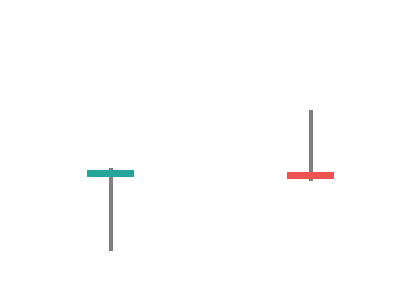
Bullish pin bar (left) and bearish pin bar (right): the long wick is the rejection, the close confirms it.
A long wick in one direction, with a small body closing away from it. A long lower wick with the close up near the top is the bullish version, where price was shoved down hard and then thrown straight back, while a long upper wick with the close down near the bottom is the same idea in reverse. It’s the same shape wearing two different names depending on where it turns up, a “hammer” after a downtrend and a “shooting star” after an uptrend, and the wick records the test while the close tells you who won it.
Example: GER40 spikes down into the Frankfurt Open low, wicks well below it, then closes back near the top of the candle, and that’s a bullish pin at a level that deserves a reaction. The same shape sitting in open air mid-session isn’t.
Marubozu
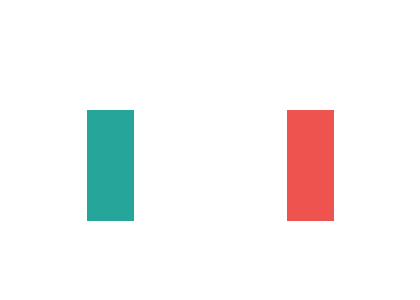
Bullish marubozu (left) and bearish marubozu (right): full commitment, no wick either end.
Barely a wick at either end: the open sits close to the high (or the low) and the close sits close to the low (or the high) for the whole period. One side had full command of the tape from start to finish, and it carries more weight breaking through a level than it does drifting through open space with nothing around it.
Example: a bearish marubozu closing straight through the Overnight Low with no wick shows momentum clearing the level, not just testing it.
Two-candle patterns
Engulfing
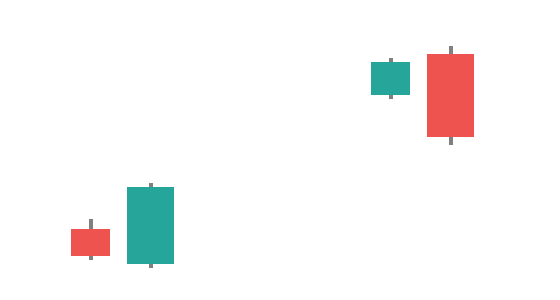
Bullish engulfing (left pair) and bearish engulfing (right pair): the second candle swallows the first.
The second candle’s body swallows the first one whole, opening beyond it and closing beyond it too. The bullish version follows a down move and closes back above where the previous candle opened, meaning buyers didn’t just stall the slide, they took the whole thing back with size behind them, and the bearish version is the same story told in reverse. It means rather more when that first candle was itself part of the existing move, because then the reversal has absorbed some real momentum, not just a quiet pullback.
Example: a sharp down candle into support, followed by a candle that engulfs it and closes above the down candle’s open, is a reversal with something behind it, and it deserves more attention than an engulfing candle that just appears mid-range.
Tweezer tops and bottoms
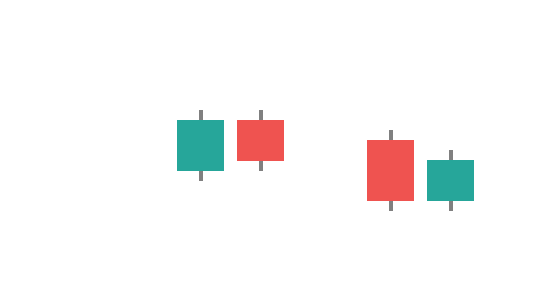
Tweezer top (left) and tweezer bottom (right): the same price tested and rejected twice.
Two candles sharing close to the same high or low, with bodies pointing in opposite directions, show the same price got tested twice and rejected twice, which gives you a cheap, quick way to see a level being defended without needing to wait for a full swing to confirm it.
Example: two consecutive candles both wicking into the same supply zone and both closing lower show the level’s being defended, even without a clean swing high to point at.
Inside bar
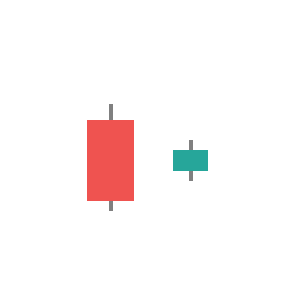
An inside bar: its entire range sits inside the candle before it.
Here the whole candle, high and low both, sits tucked inside the range of the one before it, and it’s nothing about direction, purely a question of range. Think of it as the market pausing to catch its breath after a move, coiling rather than committing. On its own it’s just compression, and what follows the coil is where the story gets interesting, which is exactly what the three-candle pattern below builds on.
Example: a strong push into a level, then a small candle that trades entirely within the previous one’s range before the session goes quiet, is the coil to watch for the break.
Outside bar
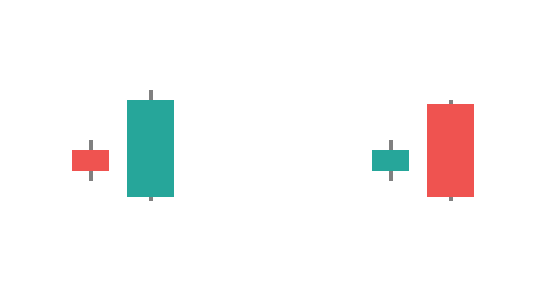
Bullish outside bar (left) and bearish outside bar (right): the whole range engulfs the candle before it, not just the body.
The mirror image of an inside bar, where this candle’s range, high and low both, completely swallows the one before it. Don’t confuse this with an engulfing candle above, which is only ever about the bodies. An outside bar is about the full range, wicks included, making it a genuine jump in participation, not just a change of mind. Everyone who was sitting on the sidelines during the previous candle showed up in this one.
Example: a quiet, narrow-range candle followed by one that trades well above and well below it, closing strongly in one direction, is a real shift in who’s turned up to trade, not just a bigger body.
Three-candle patterns
Morning star / evening star
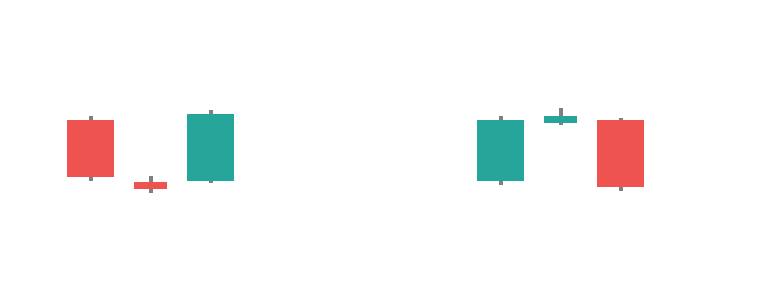
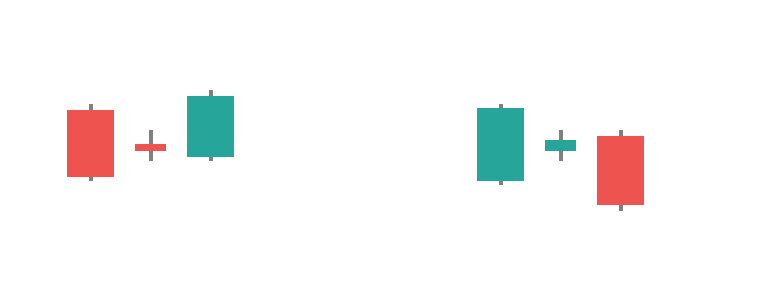
Morning star (left) and evening star (right): the middle candle is where the move loses its nerve.
A strong candle in the direction of the trend, then a small-bodied candle, often a doji, that gaps or drifts away from it, then a strong candle back the other way that closes past the midpoint of the first. That middle candle is the hesitation, the exact point where the move runs out of conviction before it turns, and you get a morning star at the bottom of a move or an evening star at the top.
Example: a strong down candle, a small doji that barely moves, then a strong up candle closing well into the first candle’s range, at a known demand zone, is a lot more interesting than the same three candles sitting in the middle of nowhere.
Three inside up / down
Three inside up (left) and three inside down (right): compression, then a real break.
The inside bar from above forms after a directional candle, then the third candle breaks its range in the other direction entirely, the coil followed by the break. It’s the same idea as the inside-bar setups in Fair Value Gaps, compression after a move followed by a genuine break.
Example: a down move into a level, an inside bar sitting quietly inside the previous candle’s range, then a candle that breaks back up through both, is three inside up, and it’s the same “compression, then break” idea you’ll see again in the FVG setups.
What matters
None of this works terribly well in isolation, and that’s where most candlestick guides come unstuck, treating the shape itself as the whole story. A bullish engulfing candle sitting in the middle of an unremarkable range doesn’t tell you a great deal, but the same candle at a support level, a session open, or a demand zone is a completely different proposition: the level is what gives the reaction its meaning.
So look at the level and the wider picture before you look at the candle. The candle only ever tells you whether the reaction is turning up.
Key takeaways
- A candlestick pattern is confirmation of what’s happening at a level, not a signal to trade off on its own
- Doji = indecision, only meaningful after a strong move or at a level you’re already watching
- Pin bar (hammer/shooting star) = rejection shown by the wick, confirmed by where it closes
- Engulfing candles carry more weight when the first candle was part of the existing trend
- Tweezers show a level defended twice without needing a full swing to confirm it
- Inside bar = compression, the whole range sits inside the candle before it, a coil rather than a direction
- Outside bar = a jump in participation, the whole range (not just the body) swallows the candle before it
- Morning/evening star = a three-candle pause-then-reverse at the end of a move
- Check the level first: the pattern only means something in context
Nothing on this page is financial advice. Trade your own account, manage your own risk.
Nothing on this page is financial advice. Trade your own account, manage your own risk.