Intro to Indicators
Every indicator is derived from price, not separate from it, and knowing what maths is running underneath one changes how much weight it deserves on your chart.
They’re all just price, transformed
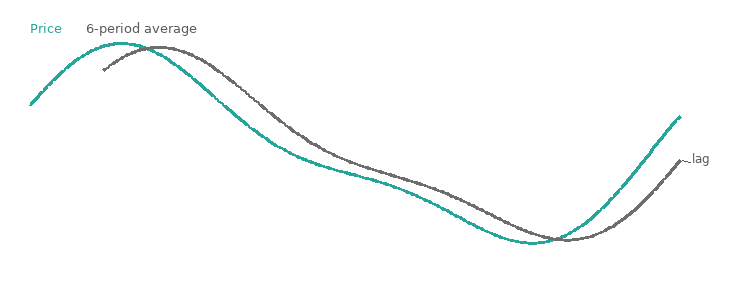
A moving average smooths price into a lagging line. Useful for context, always a step behind.
A moving average takes the last N closes and averages them, which smooths out the noise but means the line is always describing where price has already been rather than where it’s heading. An oscillator like RSI takes recent gains and losses and turns them into a bounded number, so it can flag when a move looks stretched, but it’s still built entirely from the same closes a chart already shows you. Nothing an indicator displays is new information; it’s existing price data run through a formula to make one property of it easier to see at a glance.
A few others follow the same pattern. MACD is really two moving averages set against each other, a fast one and a slow one, with the gap between them plotted as its own line, so a crossover is just one average catching up to, or falling behind, the other. Bollinger Bands wrap a moving average in a band that widens and narrows with recent volatility, so price pushing outside it is a comment on how calm or wild the last few candles have been, not a signal by itself. ATR drops direction entirely and just measures how much an instrument has been moving lately, which shows up more in stop-loss sizing than in entry signals. Stochastic is RSI’s cousin, comparing the close to the recent high-low range instead of to recent gains and losses, but it reads the same way, stretched in one direction usually means the move’s due a pause.
I read price action first and lean on one indicator to back it up: eWavesHarmonics, which handles wave counting and target price zones, and also marks fib levels, gaps, and supply and demand zones on the same chart, so I’m not juggling four separate indicators to get the same picture. It’s built the same way as everything above, existing price run through a formula, it’s just the particular transformation I’ve found useful for my own setups.
Where they help
Indicators are good at making a pattern easier to see than the raw candles alone would, and at giving a consistent, repeatable rule instead of an eyeballed judgement call. A moving average crossing from below to above price can flag a shift in short-term momentum faster than staring at candle colours would, and RSI holding above 70 for an extended stretch is a decent shorthand for “this move has been one-sided for a while.” Used this way, an indicator adds a layer of confirmation on top of what the chart is already showing.
Where they get in the way
Because every indicator lags the closes it’s built from, it will always confirm a move after it’s underway rather than before, and trading purely off an indicator crossing a threshold means reacting to old information dressed up as a signal. Stacking several indicators built from the same price data doesn’t add independent confirmation either, it just repeats the same signal in different clothing. The more useful habit is reading price action first and letting an indicator support that read, rather than the other way around.
Example: a moving average crossover flags a new uptrend just as price is already three candles into the new move, because the average needed those candles to catch up. Anyone reading price action directly would have seen the shift starting well before the crossover confirmed it.
Key takeaways
- Every indicator is price run through a formula; none of them add information a chart doesn’t already contain
- Moving averages smooth price into a lagging line; oscillators like RSI turn recent gains and losses into a bounded, readable number
- MACD, Bollinger Bands, ATR, and Stochastic all do the same trick with a different formula: two averages compared, a volatility band, pure movement, or the close against its recent range
- I keep eWavesHarmonics on my own charts for wave counting, target zones, fib levels, gaps, and supply and demand zones, but it’s still just price, transformed
- Indicators are useful for confirmation and consistency, spotting what the eye might miss
- They always lag, because they’re built from closes that have already happened
- Stacking multiple indicators built from the same price data isn’t extra confirmation, it’s repetition
- Read price action first and use an indicator to support that read, not replace it
Nothing on this page is financial advice. Trade your own account, manage your own risk.
Nothing on this page is financial advice. Trade your own account, manage your own risk.