Trendlines
A trendline is just a line connecting two or more swing points, but drawn carelessly it can be made to say almost anything, which is exactly why so many of them turn out to mean nothing at all.
Wicks or bodies as the anchor
A downtrend line connects a series of falling swing highs, the same way an uptrend line connects rising swing lows, but a single line through two points isn’t proof of anything yet, it only starts to mean something once price returns to it and reacts a third time. Two points can always be joined; a third touch that holds is what suggests other traders are watching the same line you are.
There are different ways to draw that line depending on which point of the candle you anchor to, wick or body, and no single way is the only correct one. Here’s the way I do it: anchor the older, already-confirmed swing to its wick, then anchor the newest swing to its body instead.
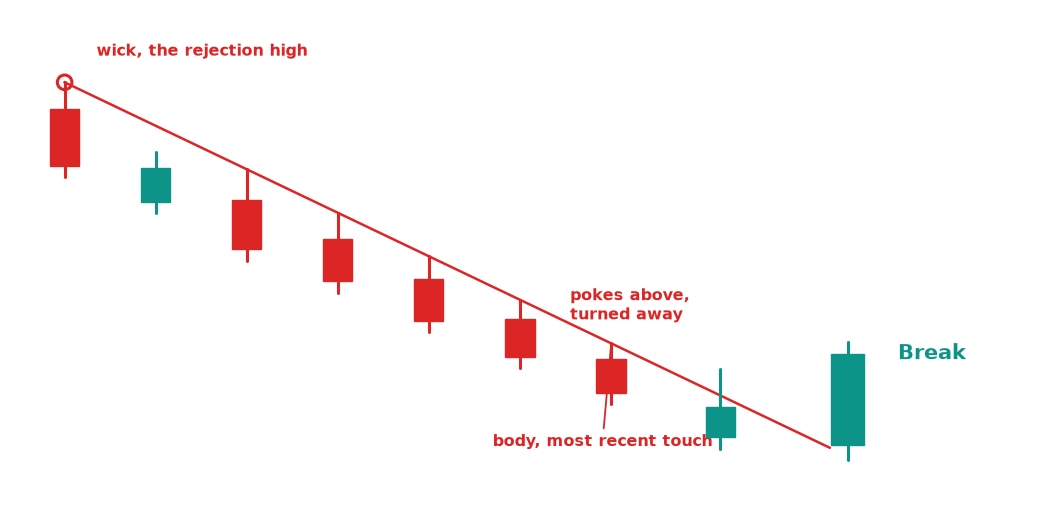
Wick for the older, already-confirmed rejection high, body for the most recent touch, holding through a small retest before a genuine break.
The reasoning is that an older swing has had time to sit there and be looked at, it’s a real high or low with a decent wick on it, a landmark everyone watching the chart can point to, so there’s no reason not to use the exact tip. The newest swing is a different story: it may only be a candle or two old, and there’s no guarantee price won’t come back and poke a little further before that swing is actually finished forming. Anchoring the fresh end to the body rather than committing to its wick keeps the line a little more conservative until that touch has had time to prove itself the way the older one already has.
Example: price makes a high, with a long wick rejecting the move to the upside, then continues to drop. Draw a line from the swing high, starting at the high of the candle, to the open of the last bear candle. If price then breaks that line by closing above it, that’s a trendline break.
The same chart shows what happens after: a small bullish candle pokes back up into the line and gets turned away, exactly the kind of retest that confirms the line is still being watched, and then a candle finally closes cleanly above it with real room to spare. That’s the difference worth holding onto, several touches that respected the line, followed by one that plainly didn’t.
Wick pokes versus real breaks
Price will often spike through a trendline on a wick and then close back on the original side, which isn’t a break, it’s a test that failed. A break that matters usually closes beyond the line, ideally with some follow-through on the next candle or two, rather than snapping straight back the way a fake break does. Treating every touch of the line as an automatic break is one of the more common ways this tool gets misread.
Example: an uptrend line has held for six touches, then a candle’s wick dips through it before closing back above. Read alone, that looks like a break. Read against the full run, it’s just the seventh test, and the trend is still intact until a candle actually closes through and stays there.
Steep lines don’t last
A trendline drawn through a sharp, near-vertical move gets broken quickly almost by definition, because that pace was never going to hold up in the first place. A flatter line connecting swings spread further apart tends to hold longer and carries more weight when it eventually does break, so the angle of the line is worth factoring in alongside how many times it’s already been tested.
Key takeaways
- A trendline connects swing lows (uptrend) or swing highs (downtrend); two points can always be joined, a held third touch is what gives it weight
- There’s more than one valid way to anchor a trendline; I anchor the older, already-confirmed swing to its wick and the newest one to its body
- A wick poking through and closing back on the original side is a failed test, not a break
- A real break usually closes beyond the line, ideally with follow-through on the next candle or two
- Steep trendlines break quickly because the pace behind them was rarely sustainable
- The more times a line has been tested and held, the more it tends to matter once it finally gives way
Nothing on this page is financial advice. Trade your own account, manage your own risk.
Nothing on this page is financial advice. Trade your own account, manage your own risk.