How to Trade Trendline Breaks

A trendline break is one of the easiest signals to spot on a chart and one of the easiest to get burned by, because a wick punching through the line and a candle closing decisively below it can look almost identical in the first second or two. Knowing which one you’re looking at is most of the skill. Drawing the line that matters A trendline connects a series of swing points, higher lows in an uptrend or lower highs in a downtrend, and the more times price has respected it, the more traders are watching the same line. Two touches is barely a trendline, it’s a line drawn through two points, which is true of almost anything. Three or more clean touches is where it starts to earn attention, because that’s evidence the market itself is treating the line as a level rather than you imposing one on the chart after the fact. ...
3 min · Clear Head Trading

Breakouts and Fakeouts

Price pokes above resistance, the candle looks decisive, and half the traders watching jump in on the break, only for price to reverse hard and leave them holding a loss inside the old range. The other half wait, watch the retest hold, and get a cleaner entry a few candles later. The difference between the two groups usually comes down to patience, not analysis. What a breakout is supposed to do A genuine breakout clears a level, support or resistance, and keeps going with enough conviction that the level stops mattering as a ceiling or floor. The clearest tell isn’t the initial break candle, it’s what happens in the few candles after, does price hold above the old resistance, or does it drift straight back below it as if the break never happened. ...

3 min · Clear Head Trading

Inside Bars and Compression

A market that’s coiling gives off a specific look before it moves, each swing a little smaller than the last, as if the energy behind the price is running out of room in both directions at once. Traders who learn to spot that shrinking range early get to position before the release, instead of chasing it after the fact. What an inside bar is An inside bar is a candle whose entire range, high to low, sits inside the range of the candle before it. One inside bar on its own doesn’t say much, it happens constantly and most of the time it’s just noise. A run of two or three in a row, each one tighter than the last, is the more useful pattern, showing the range contracting instead of one quiet candle sitting in an otherwise normal sequence. ...

3 min · Clear Head Trading
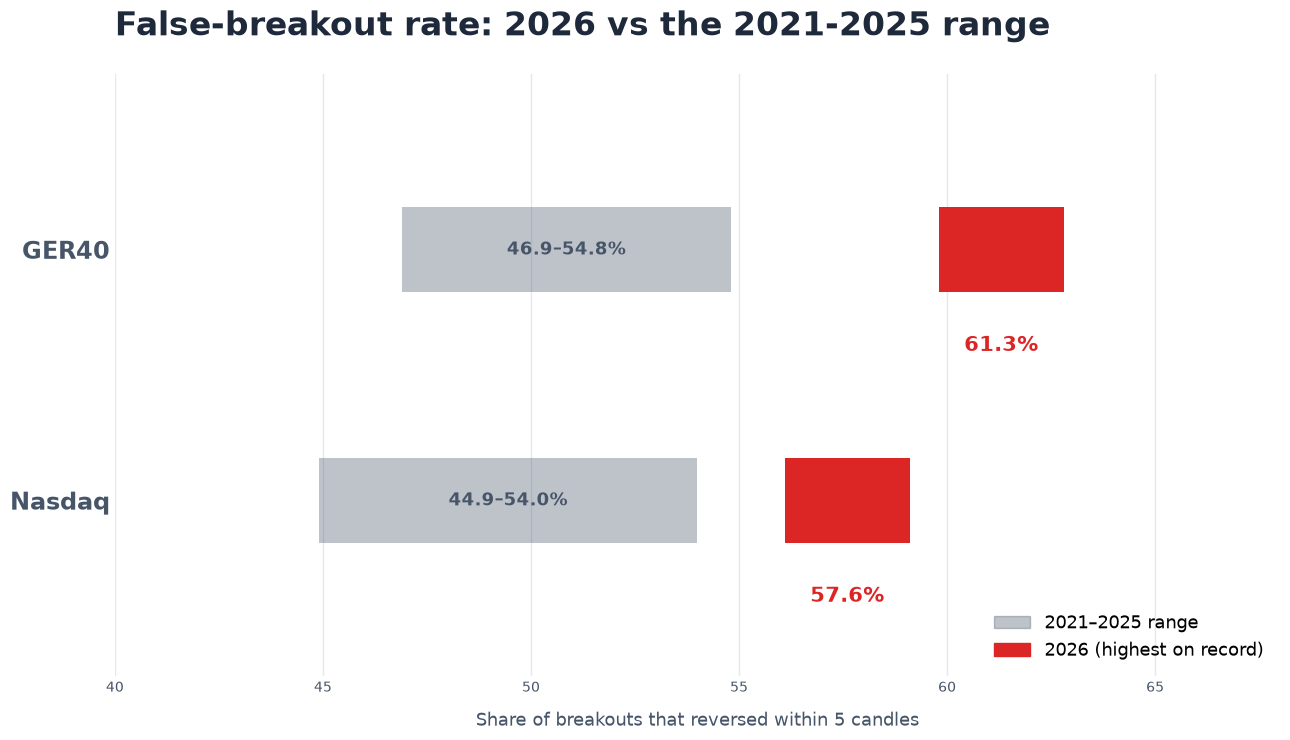
Bar chart comparing 2026 false-breakout rate against the 2021-2025 range for GER40 and Nasdaq, both at record highs in 2026

Breakouts are failing more often in 2026, and the data backs it up

I test a lot of systems against historical data, and most of the time the goal is finding an edge to trade. Every so often, the more useful thing that falls out is a measurement instead of a strategy, and this year handed me one that says more about the market itself than any strategy could: breakouts on GER40 and Nasdaq have been failing at a higher rate than at any point in the data I’ve got. ...

August 21, 2026 · 3 min · Clear Head Trading
Questions, feedback, or work enquiries — email me
This site is run by a private trader and reflects personal opinion and research, not financial advice — nothing here is a recommendation to buy, sell, or otherwise trade. Trade your own account and manage your own risk. Data, ratings, and trust scores in the Prop Firms section are compiled from public sources, independent reviews, and our own research — they are not verified guarantees of any firm's terms, financial stability, or conduct, and rules and pricing change frequently, so always confirm current terms directly with a firm before purchasing a challenge. Some links on this site are affiliate links, at no extra cost to you. This site uses cookies for analytics and, via affiliate links, for referral tracking on partner sites — see the Privacy Policy for details.